


Quick Answer
Free infographic slides function as pre-designed visual frameworks that transform raw data into digestible narratives. According to the Nielsen Norman Group, users scan content in an F-shaped pattern, making structured visuals critical for retention. Here are three takeaways for using them in 2026:
- Select for Story, Not Decoration: Choose templates that match your data structure (e.g., timelines for history, funnels for sales).
- enforce Brand Consistency: Always re-color free assets to match your corporate identity immediately.
- Simplify the Noise: Remove 40% of the default placeholder text to maintain white space.
In the high-stakes environment of global business, the “wall of text” slide is a deal-killer. Executives and investors in 2026 simply do not have the bandwidth to decode dense paragraphs during a pitch. The problem isn’t a lack of data; it’s a lack of clarity.
By leveraging high-quality, free infographic slides, you can bridge the gap between complex analytics and compelling storytelling without blowing your budget. Whether you are presenting in London, New York, or Singapore, the universal language of well-designed infographics cuts through the noise. This guide covers how to find, customize, and deploy these assets effectively.
Why “Free” Doesn’t Have to Mean “Cheap”
For years, free presentation resources were synonymous with clipart and jarring color schemes. However, the landscape has shifted. Today, professional agencies and design hubs release high-caliber presentation templates as lead magnets, giving you access to agency-grade vector assets at no cost.
In our experience redesigning over 150,000 slides, we have seen that a well-chosen free template, when properly customized, often outperforms a custom slide that ignores design fundamentals. The secret lies in selection and restraint.
Top Categories of Infographic Slides You Need
Not all infographics serve the same purpose. When building your repository of assets, focus on these four essential categories that cover 90% of business use cases:
- Process Flows & Roadmaps: Essential for product launches and operational updates. Look for chevrons and snake diagrams.
- Data Visualization Widgets: Donut charts, speedometers, and bar graphs that are editable in Excel.
- Comparison Tables: “Us vs. Them” layouts are critical for sales decks.
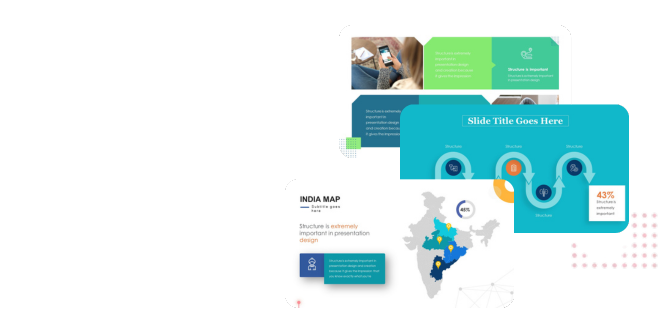
- Geographic Maps: Editable vector maps for highlighting global expansion or regional revenue.
Step-by-Step: Converting a Free Template into a Brand Asset
Downloading the slide is step zero. Making it look like your company designed it is where the real work happens. Here is the workflow our designers use when adapting external assets:
- Ungroup Everything: Most infographics come grouped. Right-click and select ‘Ungroup’ (often twice) to access individual shapes.
- Apply Theme Colors: Do not manually color pick. Go to the Design tab and apply your corporate XML color theme so the slide updates automatically.
- Standardize Fonts: Replace the template’s ‘Open Sans’ or ‘Lato’ with your brand’s primary typeface to ensure visual continuity.
- Check Accessibility: Ensure there is enough contrast between the text and the graphic background. W3C standards suggest a contrast ratio of at least 4.5:1.
3 Common Mistakes When Using Free Slides
Even with great tools, execution can fail. Avoid these pitfalls:
1. The “Frankenstein” Deck
Combining slides from five different free packs results in a presentation with conflicting styles, shadows, and icon line weights. Stick to one style pack per presentation.
2. Ignoring Data Integrity
Many free infographics use “dummy” bars that aren’t linked to real data. If you manually drag a bar to look like “75%” but it’s actually “60%”, you lose credibility. Always use data-driven charts where possible.
3. Overloading the Canvas
Just because the template has six text boxes doesn’t mean you must fill them all. Delete what you don’t need. Silence is powerful; whitespace is luxurious.
Mini Case Study: Simplifying Supply Chain Complexity
We recently consulted for a logistics firm expanding into the MENA region. They initially used a complex spreadsheet screenshot to show shipping routes. It was unreadable.
The Fix: We utilized a clean, vector-based map infographic. We highlighted three key hubs using their brand blue and greyscale for the rest of the map.
The Result: The stakeholders understood the expansion route in under 5 seconds, compared to the minutes spent deciphering the spreadsheet. This visual efficiency is what professional presentation design aims to achieve.
The “Professional Polish” Checklist
Before you hit save, run your infographic slide through this filter:
- Are all icons the same style (e.g., all outline or all filled)?
- Is the font size consistent (minimum 12pt for body text)?
- Are elements aligned to the grid?
- Is the source of the data cited in the footer?
- Does the slide pass the “squint test” (can you see the main point when squinting)?
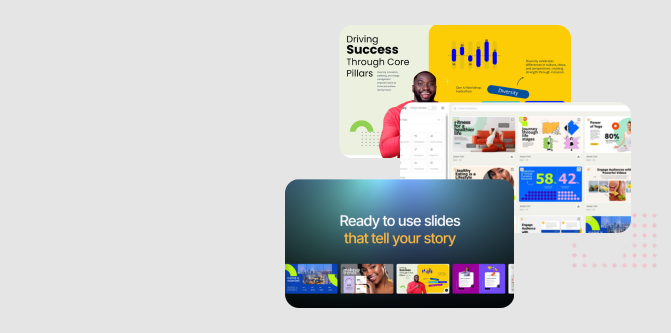
Turn Your Complex Ideas into a Captivating Presentation
PitchWorx helps founders and enterprise teams convert raw content into high-impact visual stories.
Frequently Asked Questions
Where can I find safe, copyright-free infographic slides?
reputable sources include official Microsoft/Google repositories, established design agency “freebies” sections, and platforms like Canva or Freepik. Always check the licensing agreement to ensure commercial use is permitted without attribution if that is a requirement for you.
Can I edit these slides in Google Slides and Keynote?
Most modern downloads come in .PPTX format, which is universally compatible. However, complex gradients and animations may break when converting between PowerPoint and Google Slides. It is best to work in the native format of the template.
How do I match the colors to my company brand?
Do not recolor shape-by-shape. Go to the “Slide Master” view or the “Design” tab in PowerPoint and edit the color scheme. This will automatically update all theme-linked elements in the infographic to your brand palette.
What is the difference between an infographic and a dashboard?
An infographic tells a specific story with a conclusion, guiding the viewer from point A to B. A dashboard is a monitoring tool that displays real-time status without necessarily driving a specific narrative. For presentations, infographics are usually superior.
Why do my exported slides look blurry?
This often happens when using raster images (JPEG/PNG) within the slide. Always aim to use Vector shapes (SVG, EMF, or native shapes) found in high-quality free infographic packs, as they scale infinitely without quality loss.